Validating measurements at De Middelste Molen
Validating
measurements at De Middelste Molen by Victor Reijs
is licensed under CC BY-NC-SA 4.0


Introduction
This webpage is to validate and ground proof the sensor measurements
(from smartmolen) at De Middelste Molen, by
using KNMI-Cabauw meteorological station en Open-Meteo data.
GIS functionality was build using R, Excel and VBA functions (to
determine windspeed&direction, z0, a resolution of
a 10deg windrose; based on some 6 speed factor formula to
determine windloss).
Meteorological station KNMI-Cabauw info
In general
Looking at Benschop [2005b Chapter 3] the conditions of
meteorological stations should be:
- The roughness z0 should be < 0.5 m in all
directions. This condition implies a shelter factor SF [Shelter
Factor aka 'my' speedfactor] of < 1.2 (less than 20%
reduction of the average wind speed).
- The distance from the wind mast to any obstacles in the
vicinity must be at least ten times and preferably twenty times
the height of the obstacle (applies to all obstacles).
- The terrain in the immediate vicinity of the wind mast (radius
≥ 100 metres around the measurement site) is flat grassland or a
water surface.
KNMI-Cabauw
Met.
station
KNMI ID
|
Location
|
Distance
with
De Middelste Molen
|
348
|
Cabauw
|
3.6km
|
Location:
WGS84 (Latitude 51.97028827, Latitude 4.92618799);
Rijksdriehoeksstelsel (X 123320, Y 442530)
DSM data (AHN4: R_38EZ1.tif)
The wind direction and speed are provided at the reference height
of 10m.
Windspeed and direction at KNMI Cabauw
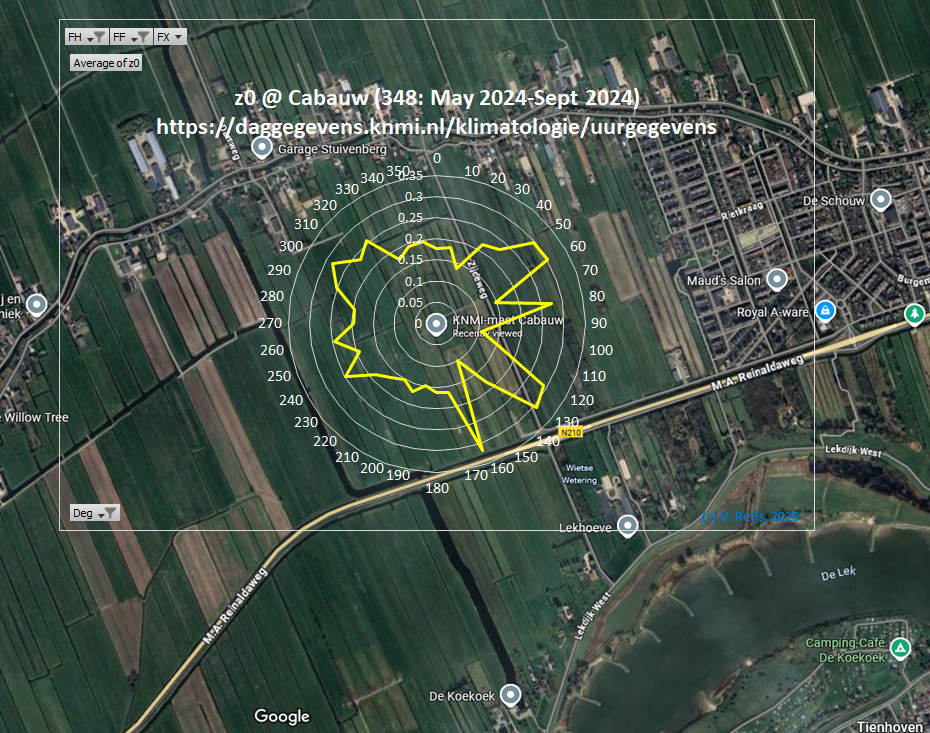
Evaluation of z0
KNMI-Cabauw stands in between open and roughly open environment
[Davenport, 2000]. So a likely z0=0.05m.
Using average wind (>=5m/sec@10m) and gust speeds
(hour averaged) and a minimum of 20 measurements in each
direction sector [Beljaars, 1987, page 17] at Cabauw [Benschop
2005b Chapter 1 & pers. comm. van der Meulen, 2025] we get an
z0 with an average around 0.20m (during leafed period:
May-September):
The z0 is also determined by using the DSM/GIS data
(800*800m) around KNMI-Cabauw (some artefacts [guy cables,
measurement platforms, errors, parallax] around the KNMI-mast were
removed); we get the following picture:

The high z0 at 40deg, 100deg and 150deg are caused by
high trees rows at 8m@330m, 11m@380m and 6m@360m.
This gaves an average z0 of around 0.08m (in the graph
3*z0[m] has been depicted as a percentage).
At this moment the z0 derived from the gust speeds is
used: z0=0.2m.
De Middelste Molen info
Location:
WGS84 (Latitude 51.96589782, Longitude 4.87169194);
Rijksdriehoeksstelsel (X 119574, Y 442066)
DSM data (AHN4: R_38BZ2.tif)
The height of the anemometer (wind speed and direction) is around
16m from the field level (sail tip from ground: 0.5m + sail
length:13.5m + anemometer on finial [makelaar] related to
poll end [askop]: 2m).
A compasite view from behind the
finial, towards the open landscape over the ridgeboard [vorstplank])
(right click to see the full picture):

A picture made by M. Piet (© 2025)
The church (@213.85deg) and water tower (@213.94deg) at Schoonhoven
can be seen at the horizon (using Google Earth). When extending the
ridgeboard to the horizon and extrapolating the direction of church
and water tower; we get a direction of the cap of around 213.8deg
(teh yellow arrow); say 214deg rounded to nearest degree.
Evaluation of z0
De Middelste Molen is in a open environment. So a likely z0=0.03m.
The z0 is determined by using the DSM/GIS data
(800*800m) around De Middelste Molen, we get the following
picture:
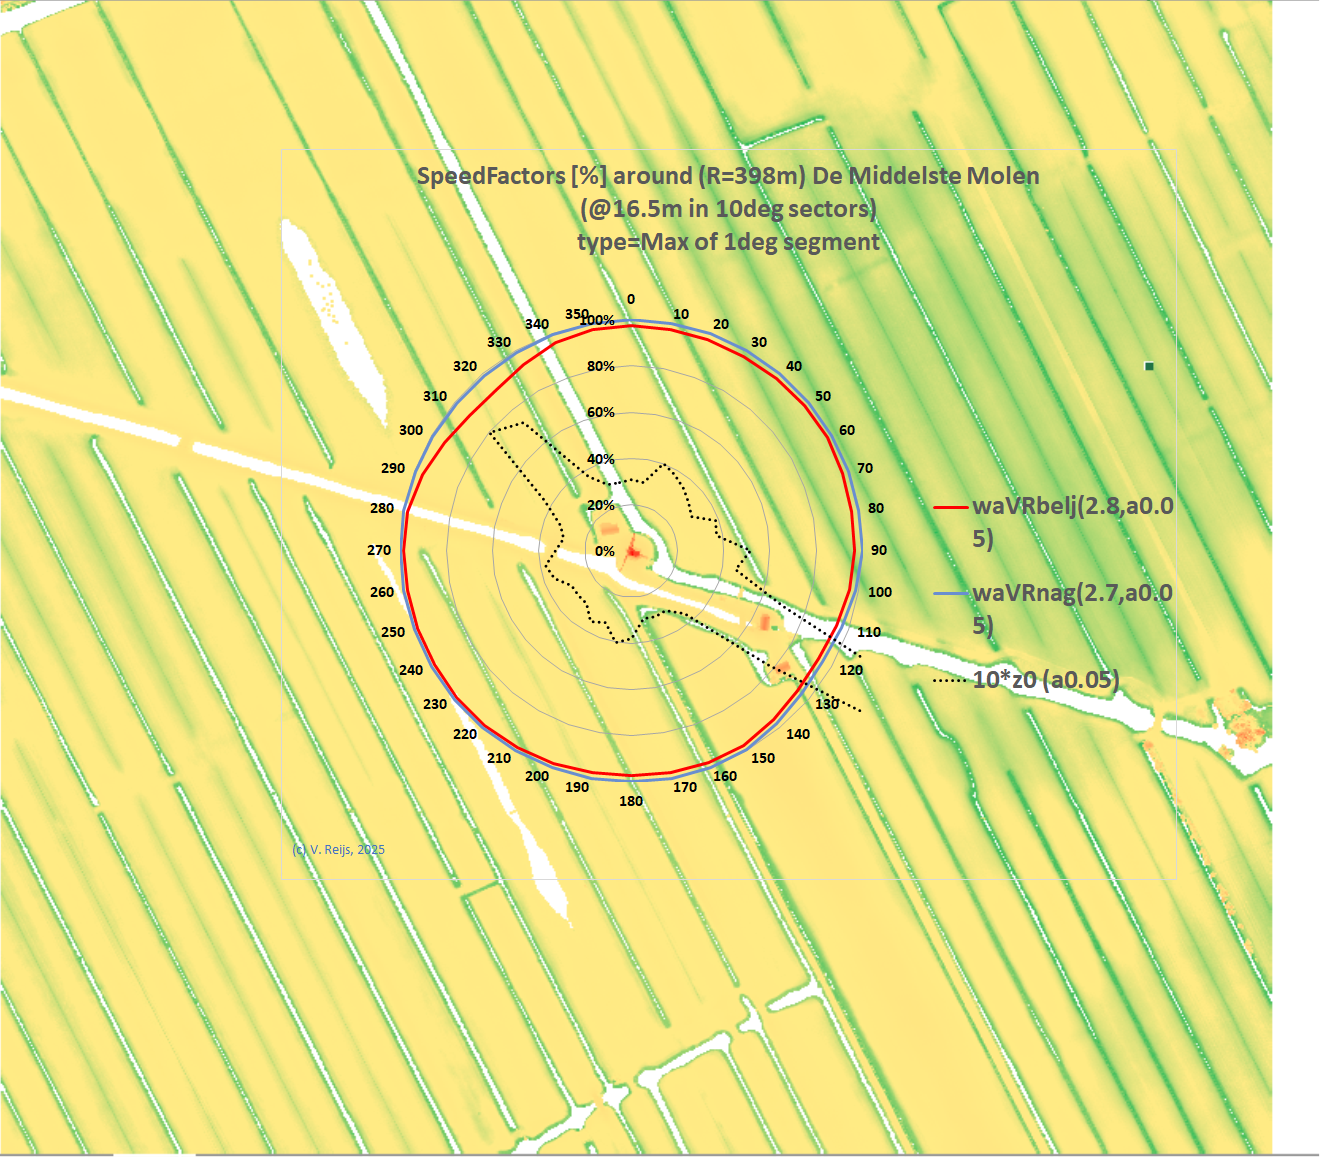
The larger z0 at 120deg (0.24m) and 315deg (0.08m) are
due to the pumping station&house (8m@100m) and house (5m@25m)
near the mill.
When removing these peaks an average z0 of 0.03m is
seen (in the graph 10*z0[m] has been depicted as a
percentage).
Alignment error at De Middelste
Molen
Photometric method
Below needs to be measured on site.
The above photograph is being used
to check the mill cap's orientation reported by the magnetometers.
The ridgeboard is at 214deg.
The reported direction in smartmolen at that moment is:
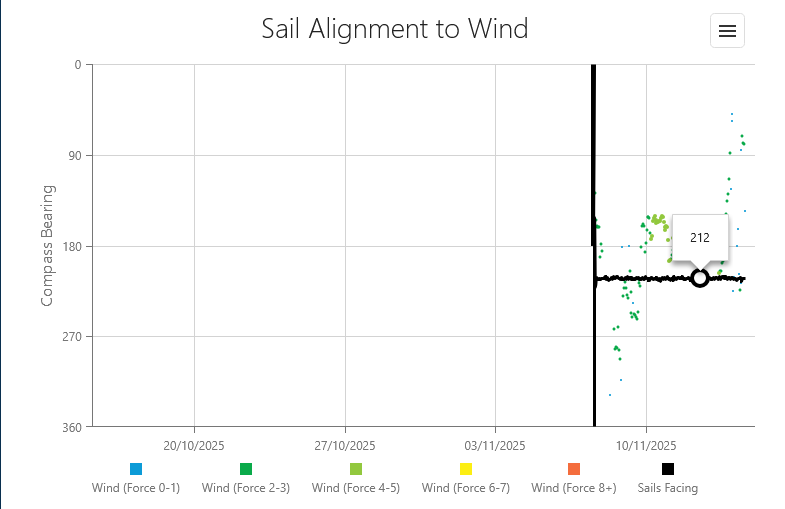
The sensor measurement at the time of the photo was around 212+/1deg
(1sigma).
We need to recognise that the magnetometer calicrator is still
ongoing, so thing smigth chnag ein the coming weeks/months.
So the sensor direction readings looks to be
needing some alignement: increasing it with 2deg.
Wind speed
KNMI: https://daggegevens.knmi.nl/klimatologie/uurgegevens
OpenMetero: https://open-meteo.com/en/docs/historical-weather-api?latitude=51.970242&longitude=4.926193&start_date=2024-05-01&end_date=2024-09-30&hourly=wind_speed_10m,wind_direction_10m
As the wind speed is referenced to a height of 10m, we need to
determine the speed at the mill's anemometer height (which is 16m)
to be able to compare like with like.
It is assumed the average roughness length at meteorological
stations is z0a=0.2m and assuming the average roughness
length at the mill's anemometer is z0m=0.03m. Looking
at the panorama's at each location, the mill's will likely have a
lower z0.
The speed at anemometer height (16m)
will have an additional increase of [Beljaars, 1979, page 4]:
ushaft=u10*(ln(60/0.2)/ln(10/0.2))*(ln(16/0.03)/ln(60/0.03))
= u10* 1.08
Wind direction
KNMI: https://daggegevens.knmi.nl/klimatologie/uurgegevens
OpenMetero: https://open-meteo.com/en/docs/historical-weather-api?latitude=51.970242&longitude=4.926193&start_date=2024-05-01&end_date=2024-09-30&hourly=wind_speed_10m,wind_direction_10m
Wind roses
The wind roses for Cabauw and De Middelste Molen have been
derived from KNMI-Cabauw (in pirinciple only for location
Cabauw) and OpenMeteo (the same for both locations as
they are within the OpenMeteo grid resultion of 9km) data:
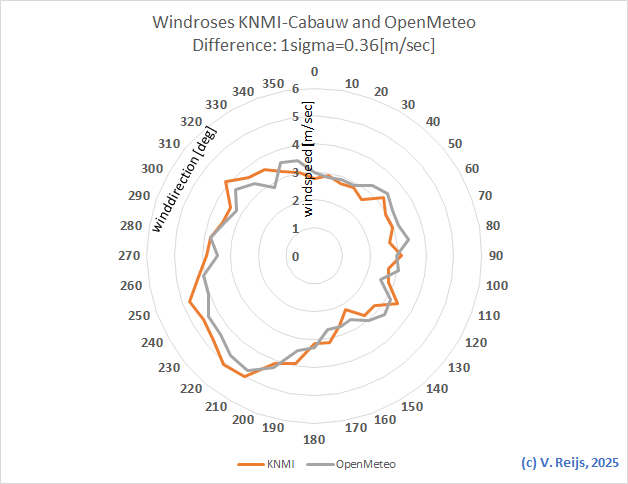
The two roses are comparable (difference 1sigma=0.36m/sec).
Sanitising the smartmolen database
The opendata database for De
Middelste Molen is here:
https://api.smartmolen.com/export/csv/summarised/cabauw/2025-11-01/2026-04-01/60
The mill (cabauw) can be changed to other mills in
smartmolen; the first date (2025-11-01) is the start date
from which one wants the data; the second date (2026-04-01)
is the end date; and the interval (60) is the interval [in
minutes] over which the data is averaged.
A few things are selected from the dataset of the smartmolen
database:
- rows with a wind speed below 1.5m/sec (1Bft) and higher than
13.9m/sec (7Bft) are removed
- rows that have an MILL_ORIENTATION_CONFIDENCE of lower than 20
are removed
- remove rows with an absolute direction angle difference
between De Middelste Molen and meteorolocal station/OpenMeteo of
larger than 90 degrees.
Analysis of the measurements
Comparing with De Middelste Molen
To compare meteorological station's speeds with De Middelste Molen
anemometer speeds, we might need to use IDW or another methodology
[Apaydin, 2004]. But Cabauw-mast and De middelste Molen are quite
close, so no 'interpolation' is used.
<the
text below needs to be adjusted as soon as any De Middelste
Molen data becomes available>
Wind speeds
The wind direction of the meteorological stations can be seen
below with the wind direction at De Middelste Molen mill on the
x-axis (for 1Bft upto and including 7Bft). The meteorological
station's speeds have been compensated for the height of the anemometer.

Speed comparison at the mill cap
Expectations
What is to be expected when looking at the wind speed effects
around the anemometer, which is some 2m above the mill cap? The
wake will have influence, by increasing or decreasing the
windspeed at the anemometer. The following effects could happen
(negative angle of attack [AoA] means a backed wind and positive
AoA means veered wind):
- If the wind comes from the back (AoA lower -150 or higher
than150deg).
It is expected that the wind speed of the meteorological station
will be similar (close to 100%) to the anemometer's if wind is
from the NNE to SSW; or the meteorological station's could be
higher than the anemometer's if the wind comes over the town
(SSW to NNE).
This situation is not happening in reality a lot. In the below
analysis this is could not be checked, as there were not enough
measurements for this situation.
- If the wind comes from the front (AoA between -30 and 30deg).
It is expected that the wind speeds of the meteorological
station will be higher or smaller than at the anemometer's if
wind is from the NNE to SSW. The higher or smaller depends on
the effect of the wake due to the mill cap (see also). The
meteorological station's speed would likely be higher than the
anemometer's if the wind comes over the town (SSW to NNE).
This situation happens a lot.
- If the wind comes from the side (AoA between -45 and -135deg
or between 45 and 135deg).
This will have an in between effect of the earlier two bullets.
This situation happens a lot between 45 and 105deg or -45 and
-105deg. In the below analysis angles outside this range could
not be checked, as there were not enough measurements for that
range.
Evaluation
From above graph it shows that the averaged wind speed of the
meteorological station is ??? (KNMI-Cabauw: purple dots) than the
speed at De Middelste Molen (LOCAL).
A few possible phenomenon need to be kept in mind when
comparing:
- The utilised z0 for the mill and the meterological
statiosn need to be as close as possible to reality.
- The recommendation for meteorogical stations is in general z0<0.5m
[Benschop, 2005, chapter 3], the
z0 for HERW was determined using this method,
and was around 0.26m.
- The accuracy of the
anemometer is around 5%.
- The anemometer might be in the wake of the
mill cap; this would introduce a higher or lower wind speed,
depending where the anemometer is in the wake.
Rijn en Lek's anemometer is at a height of 1.09*Hcap,
it is not 100% sure what would happen at this height, will it reduce
or increase the wind speed.
To be verified with a CFD of the
mill-body.
Conclusion???
Wind direction
The relative wind direction of the meteorological
stations can be seen below (relative to the wind direction at De
Middelste Molen mill). The meteorological station's directions
have been compensated for the average winds direction in winter.
De Middelste Molen wind direction (on x-axis) has been compensated
for the alignment error.
The distribution of directions can be seen below:

The standard deviation of relative meteorological
stations' direction is some ???deg. Assuming that the standard
deviation of the meteorological stations' and anemometer's wind
direction are similar, they are both around 15deg.
Matching mill anemometer readings with
calculations
De Middelste Molen
The above compensated direction and wind speed data have been
used. The speedfactor has been derived by dividing the De Middelste Molen (LOCAL)
anemometer's wind vector by the meteorological (Carbauw and
OpenMeteo) station's wind vector. From these, the (non-weighted)
average speedfactor magnitude per 10deg sector has been derived.
<right click a picture, to see a larger version in another
browser window>
De
Middelste Molen&KNMI-Cabauw
|
De
Middelste Molen&Open-Meteo
|

|
 |
- Looking at the anemometer measurements
- Mesurements are for the period 8 November 2025 to 13 March
2026, so winter time (November upto and
including March). The trees are leaveless.
- Leaved trees are between May and upto inlcuding
September
- ???It looks that the anemometer speeds are most of the time
higher than at KNMI-Cabauw. That would not have been expected.
- Non weighted sectors were used.
- The speedfactors (anmometer/meteorological) have been
decreased with a scaling factor of ~??? to match somewhat the
calculations.
- ???The wind did not blown a many times from North North
West), so the uncertainty (the yellow dots around the white
curve) of the Speedfactor is larger.
- ???Open-Meteo data (in Winter time) matches reasonably well
with the calculations (of Summer time)
We have around 80days of
measurements, this migth not be enough to reduce
uncertainty. Longer period of measuring is needed,. As we
need to keep season in minds; so over multiple (2???)
years.
- Remember there is a scale factor that mapped speedfactor
on the calculations.
- Looking at the De Middelste Molen calculations (aVRnag and
aVRbelj)
- Difference between speedfactor with anemometer and the
calculation is smallest for aVRbelj.
So aVRbelj is being used in further
analysis.
- Non weighted sectors were used.
- The trees are calculated as leafed, so summertime.
- Wind channeling is not covered by the calculations (one
would need CFD for that).
Some conclusions
<to be added>
References
Apaydin, Halit et al.: Spatial Interpolation techniques for climate
data in the Gap region in Turkey. In: Climate Research
28 (2004), issue 1, pp. 31-40.
Beljaars, A.C.M.: Windbelemmering rond windmolens. In: (1979).
Beljaars, A.C.M.: The measurements of gustiness at routine wind
stations: a review. In: WR87-11(1987).
Benschop, Henk: Representativiteit windmetingen, in het
bijzonder op luchthavens. In: (2005a), issue KNMI Technisch
Rapport TR-277.
Benschop, Henk and Jitze van der Meulen: Quality and representativity of wind
measurements. In: WMO Technical Conference on Meteorological
and Environmental Instruments and Methods of Observation (4-7 May
2005). WMO/TD-No. 1265, Instruments and Observing Methods Report
No. 82 2005b.
Davenport, Alan G. et al.: Estimating the roughness of cities and
sheltered country. In: 12th applied
climatology.2000.
Meulen, Jitze P. van der Wind measurements: Potential wind speed
derived from wind speed fluctuations measurements, and the
representativety of wind stations. In: WMO in Instruments and
Observing Methods Reports 74 (2000), issue 1028, pp. 72-75.
Acknowledgements
I would like to thank people, such as Jitze
van der Meulen and others for their help, encouragement and/or
constructive feedback. Any remaining errors in methodology or
results are my responsibility of course!!! If you want to
provide constructive feedback, please let me know.
Major content related
changes: August 17, 2025
