NEW
RWM is at: 55.7228° N 38.2049° E
MSK Sun rise is around 05:39UTC and MSK Sun set is around
12:59UTC.
CHU is at: 45° 17' 47" N, 75° 45' 22" W
Midway CHU (in Atlantic) is around: 49.7° N 41.1° W
Midway CHU Sun rise is around 10:40UTC and Midway CHU Sun set is
around 18:42UTC.
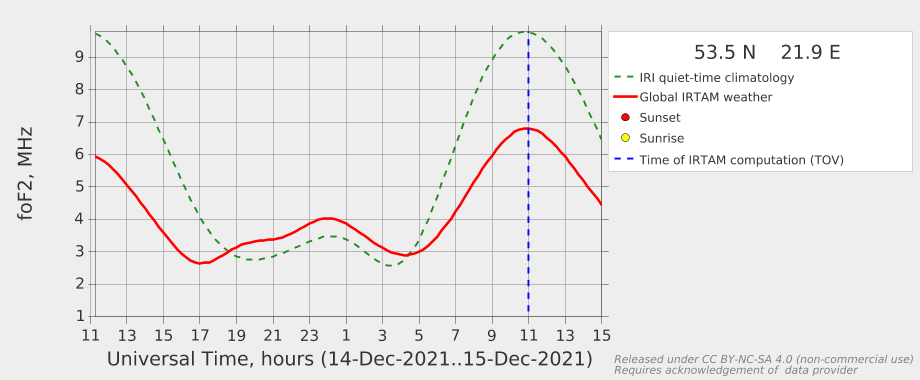
Midway RWM (in Poland) is around: 53.5° N 21.9° E
Midway RWM Sun rise is around 06:32UTC and Midway RWM Sun set is
around 14:12UTC.
| miniwhip-pro active antenna @
7m height indoors, 1st stable setup <deviation between -1 and 1Hz> |
|
| 1/12/2021 |
 Upto 13:30UTC startup problems with hard- and software. |
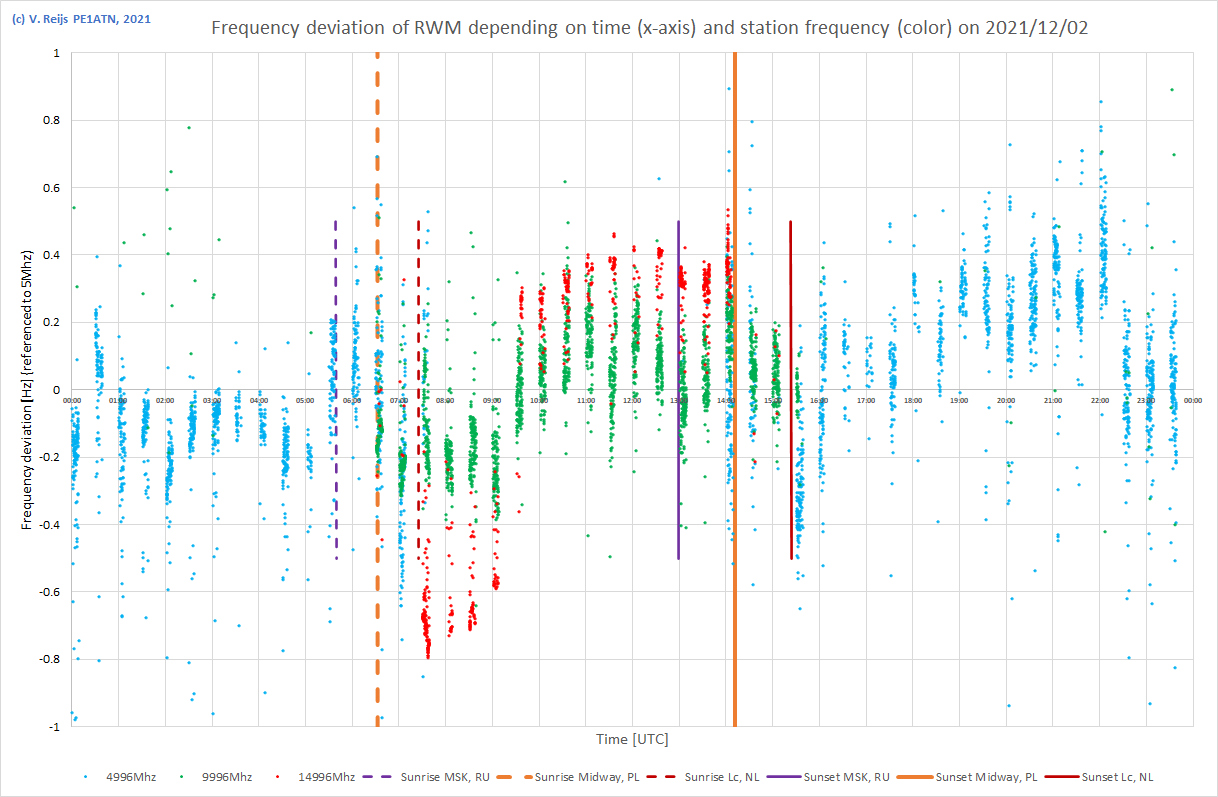
| 2/12/2021 |
 |
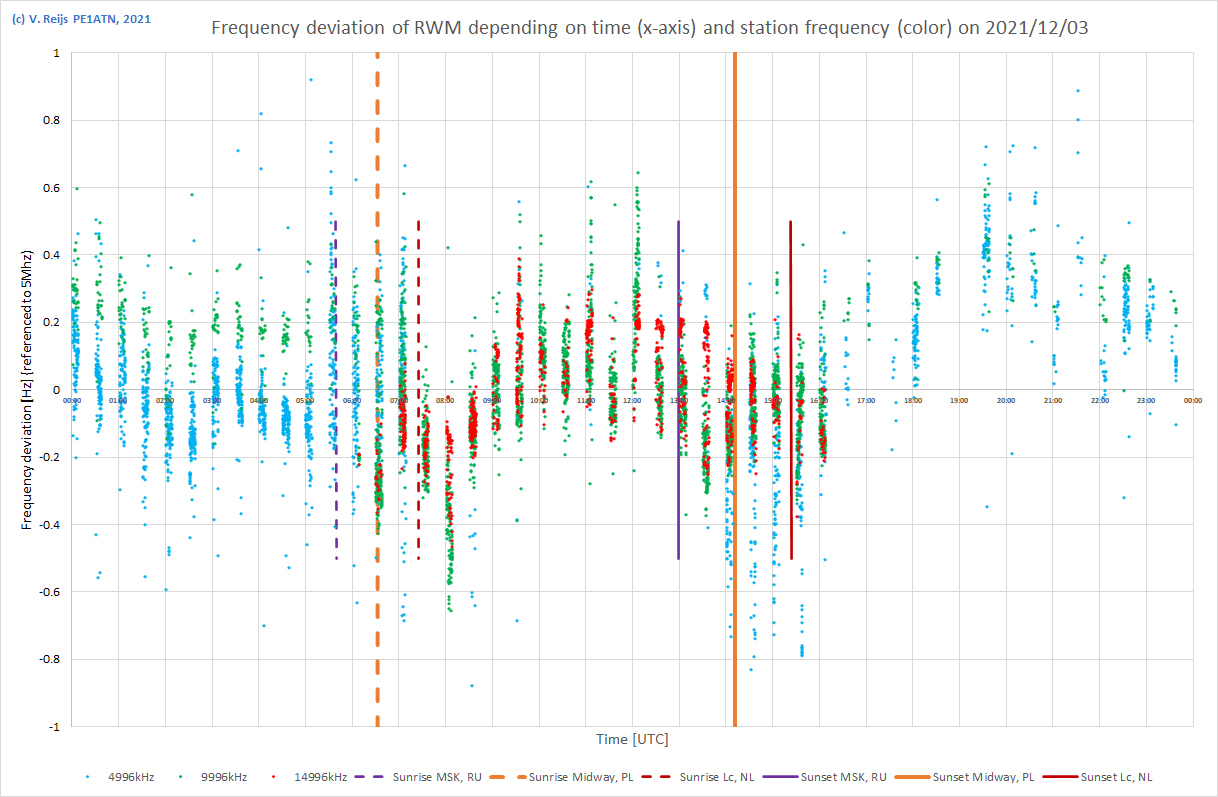
| 3/12/2021 |
 |
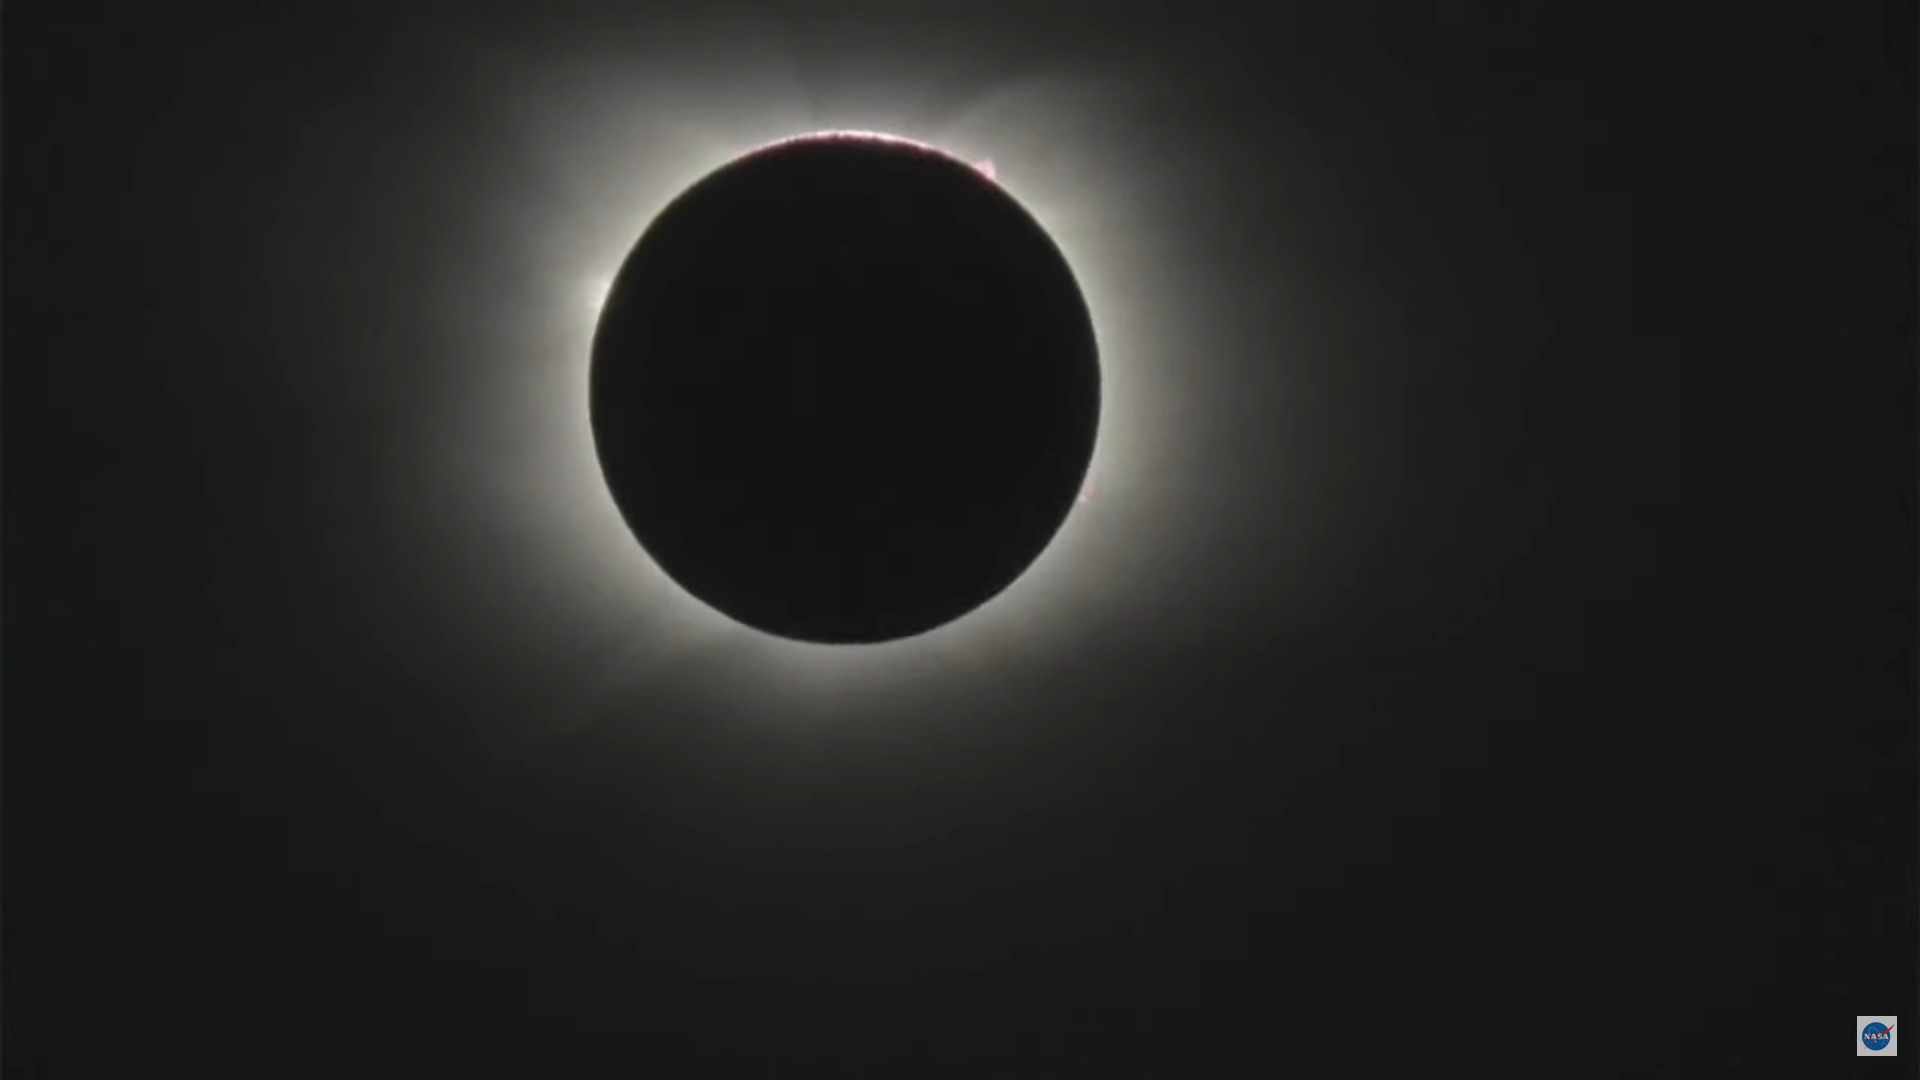
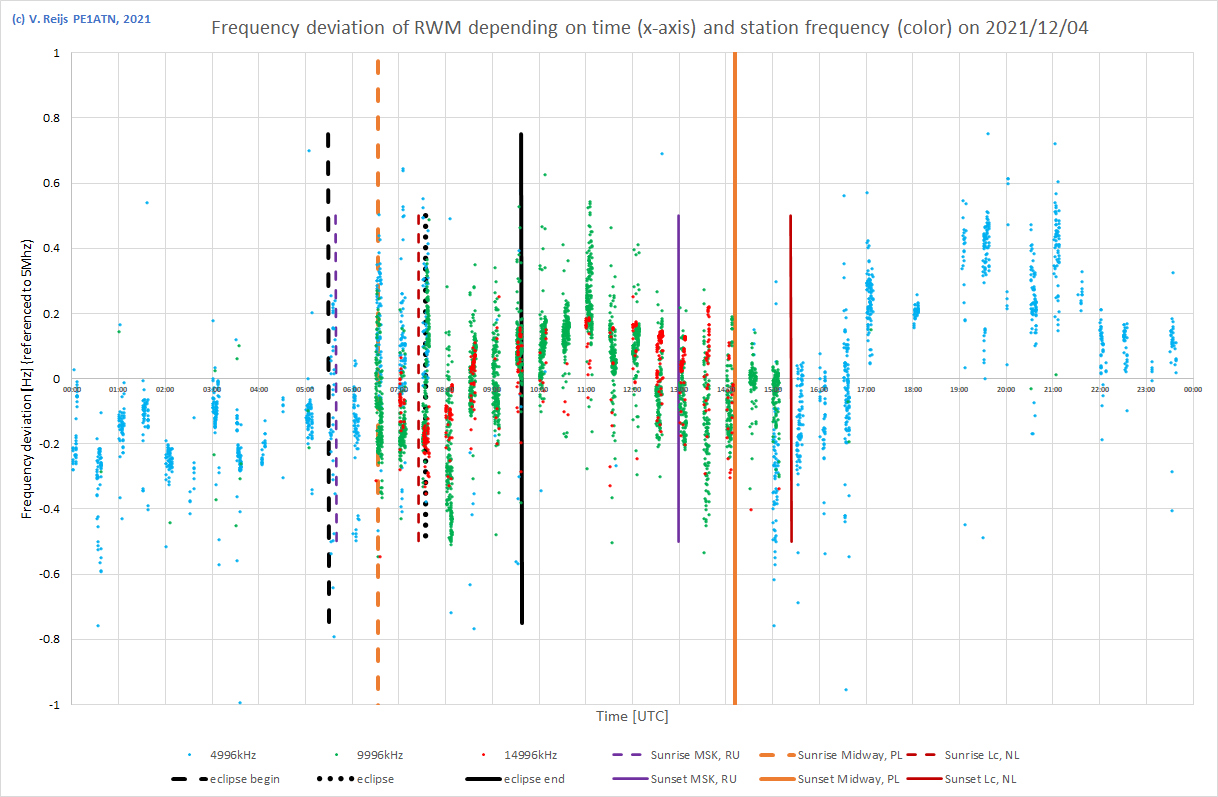
| 4/12/2021 Eclipse day |
 |
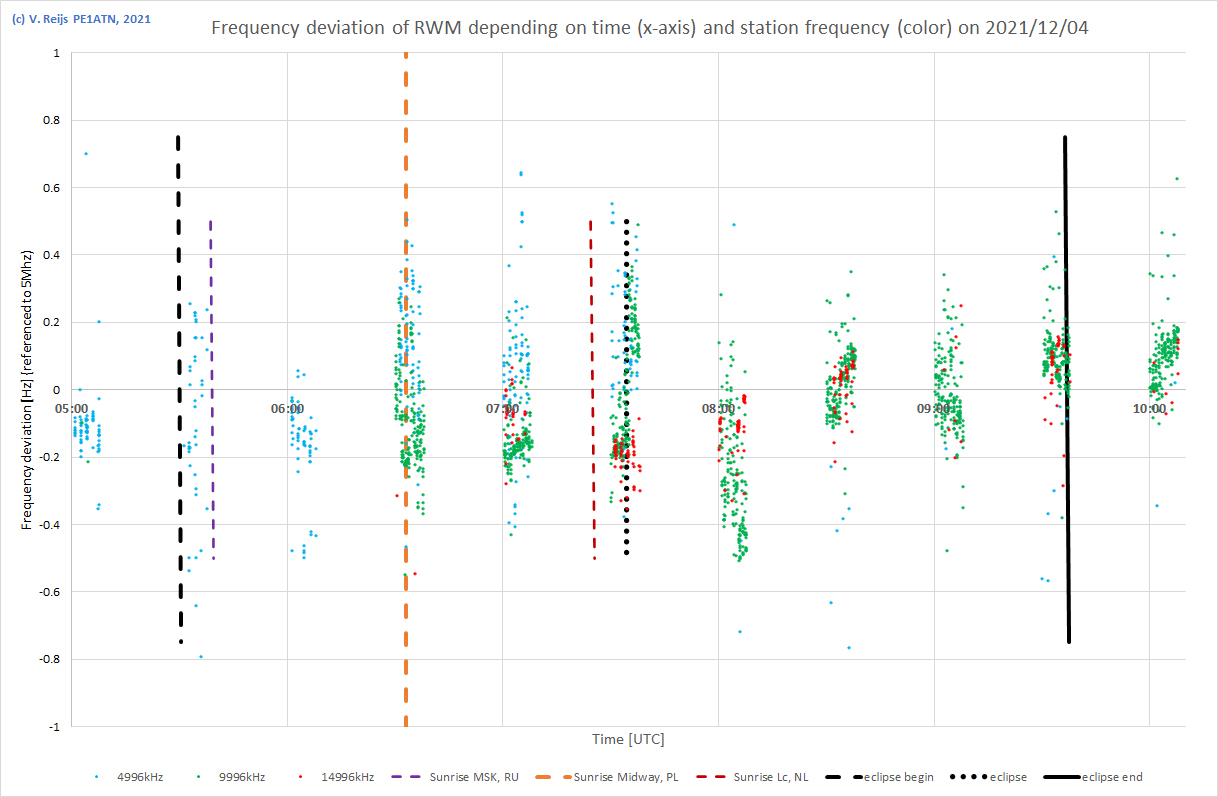
| 4/12/2021 5:00-10:15UTC |
 |
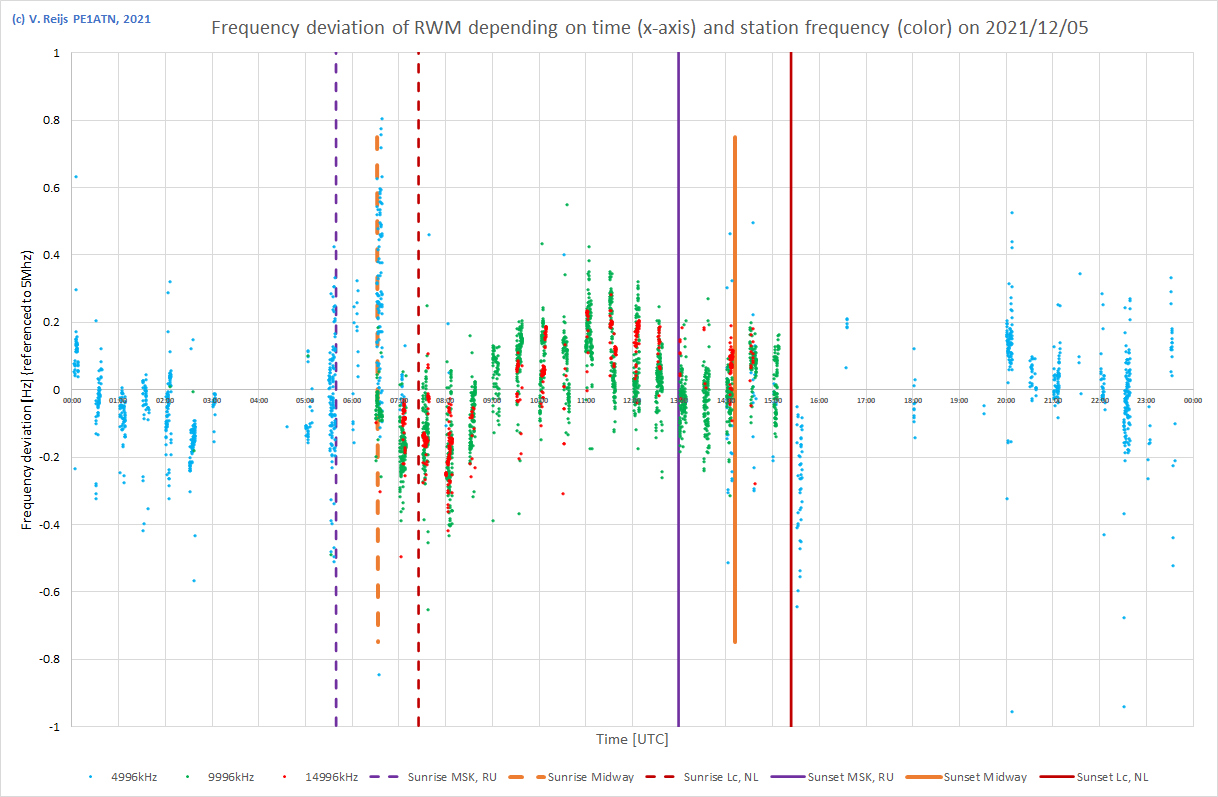
| 5/12/2021 |
|
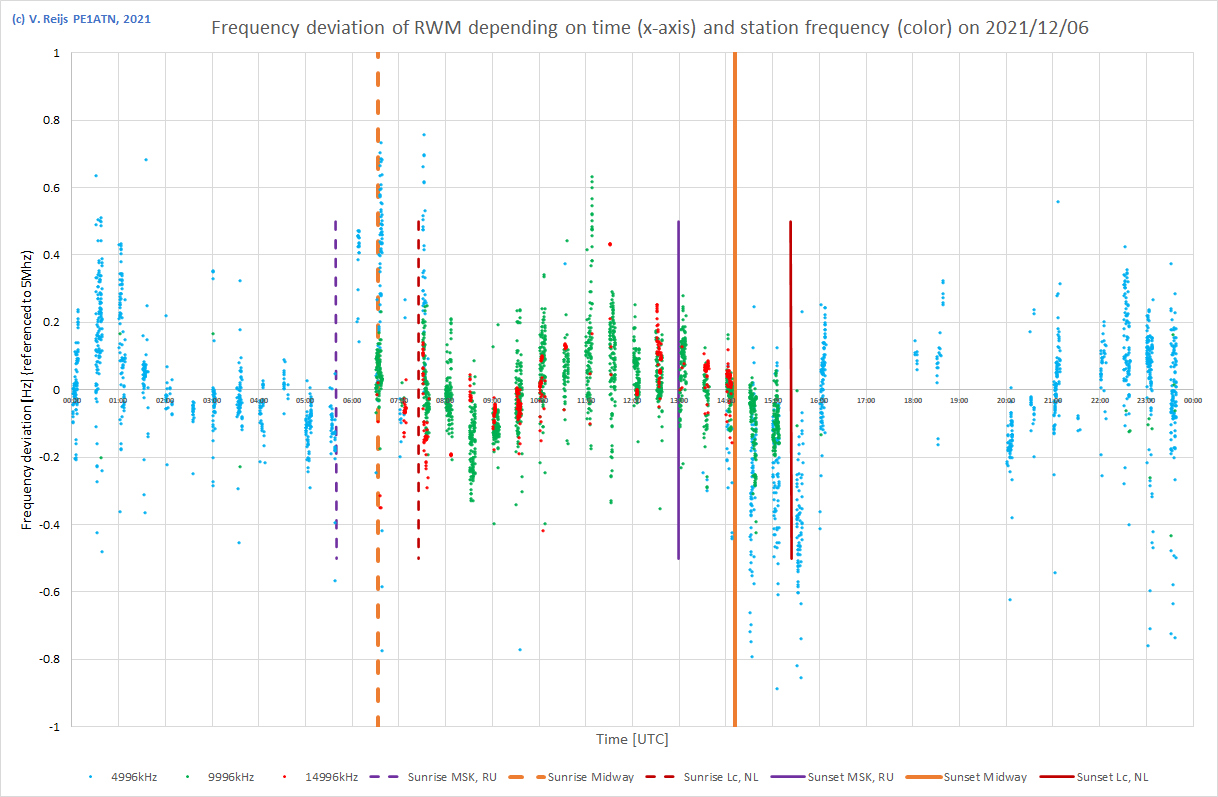
| 6/12/2021 |
|
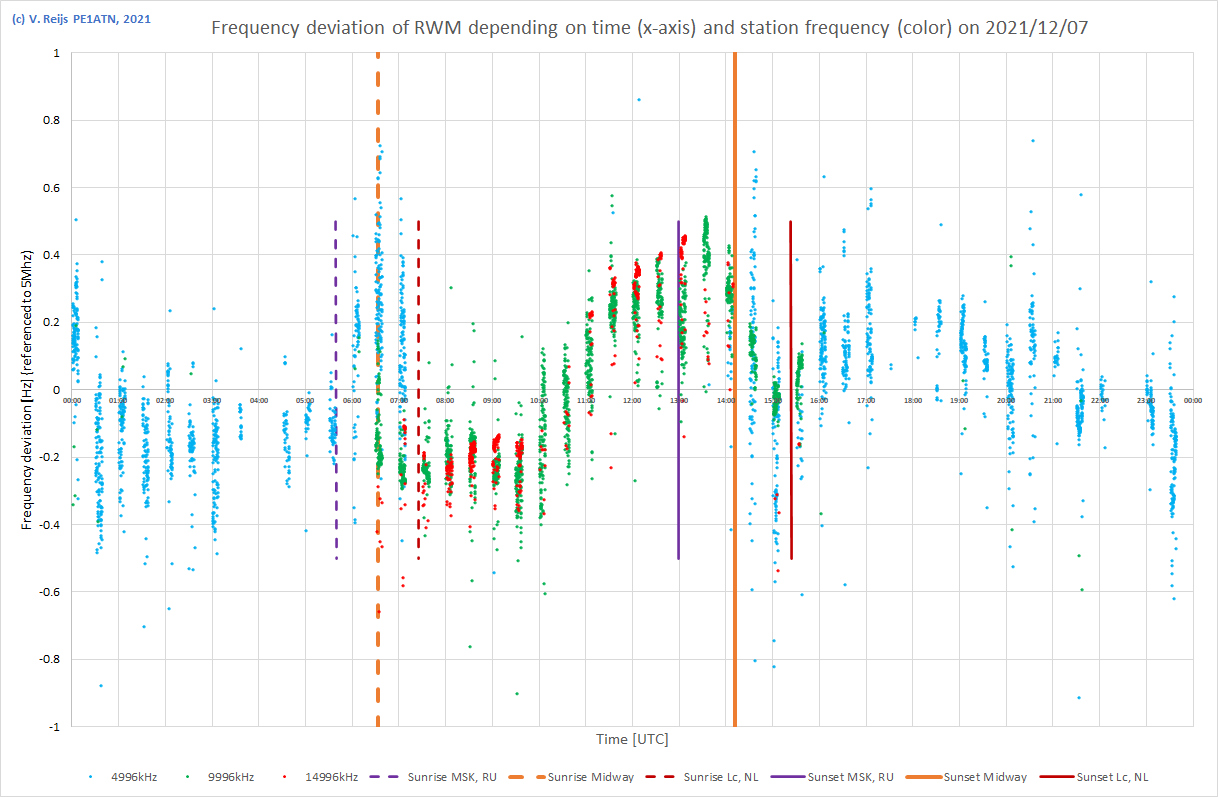
| 7/12/2021 |
|
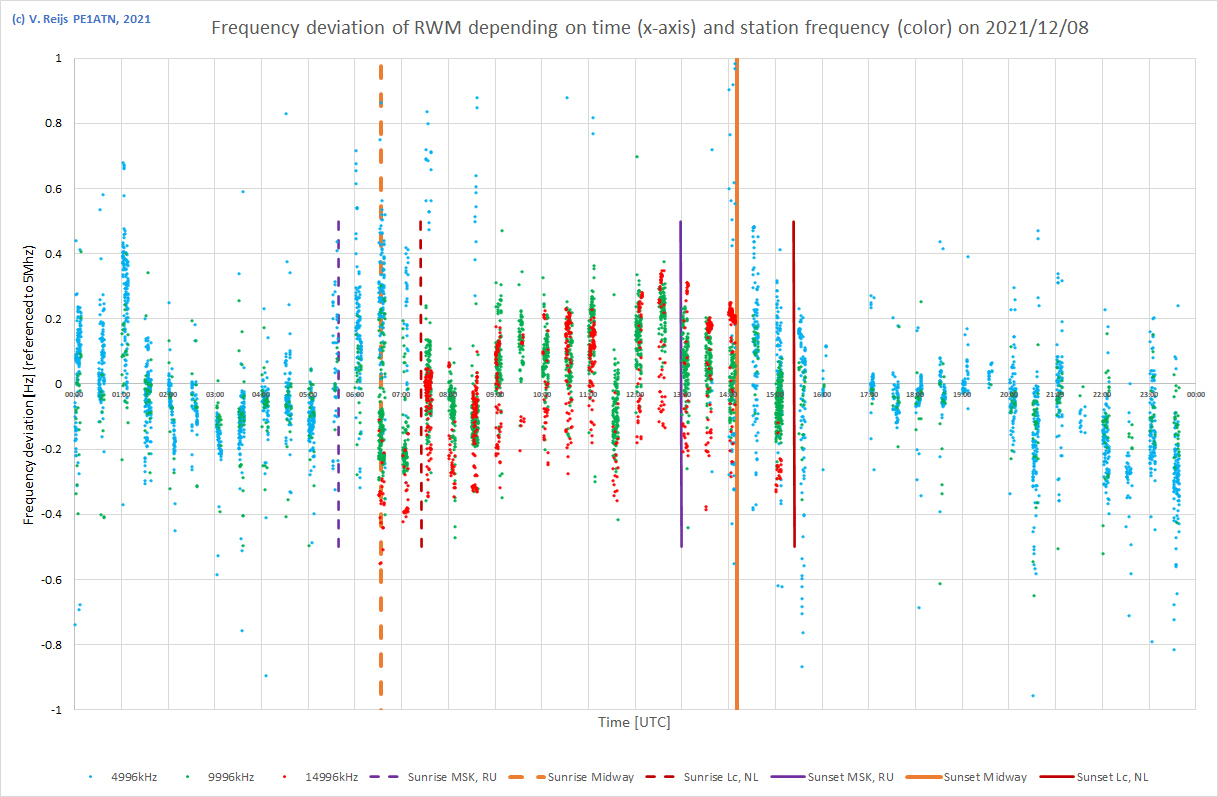
| 8/12/2021 |
|
| 9/12/2021 |
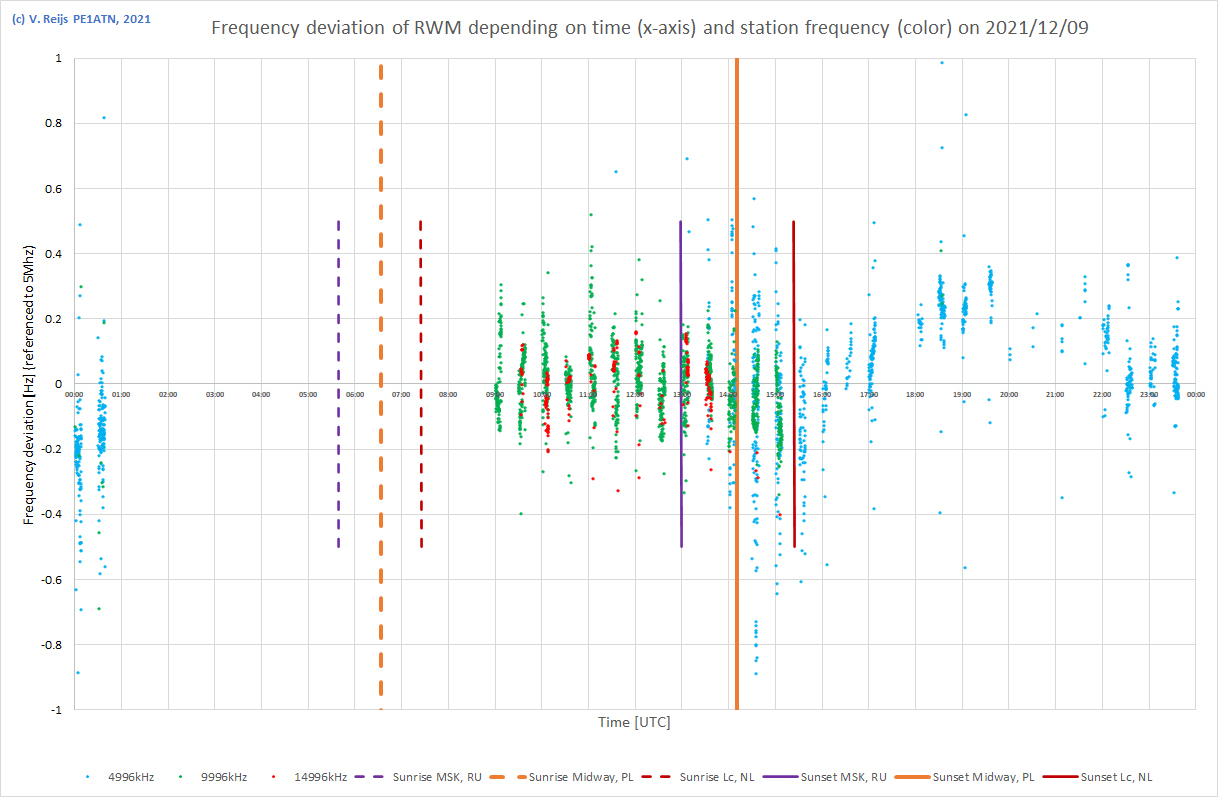 PowerSDR had
crashed between 01:00 and 09:00UTC
|
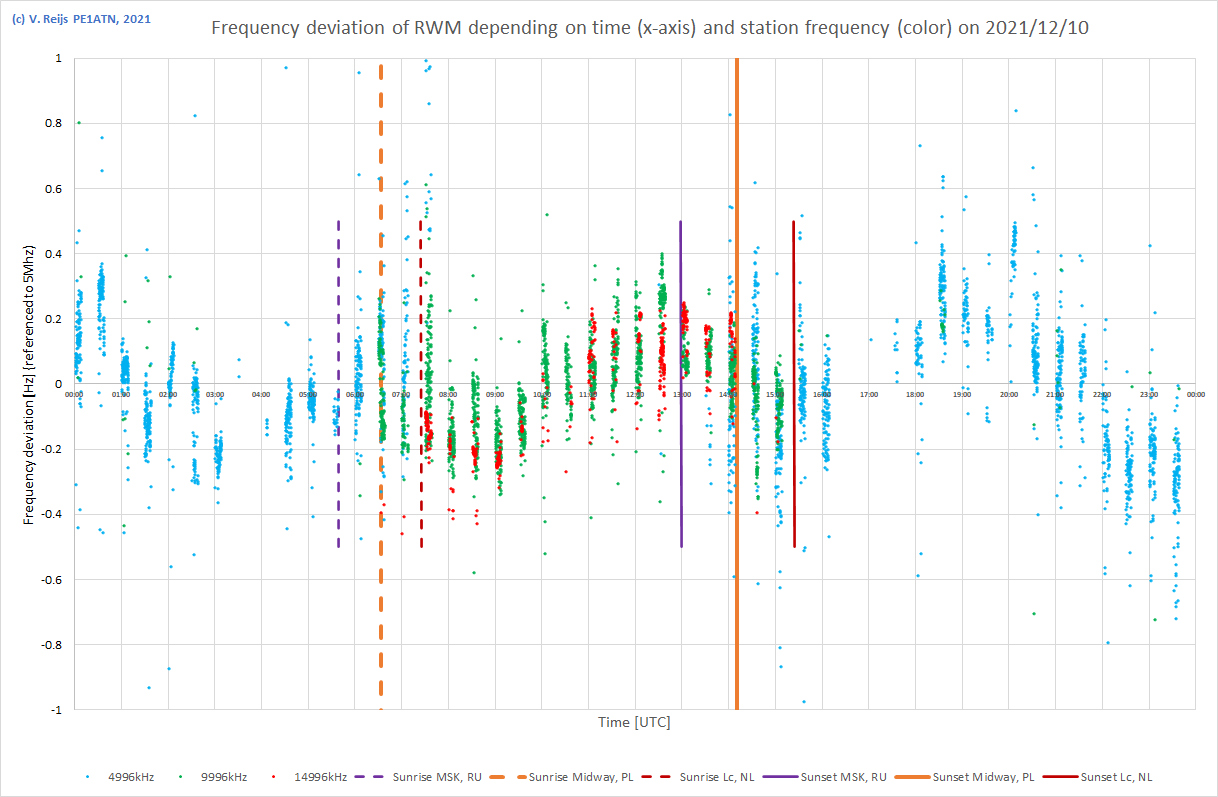
| 10/12/2021 |
 |
| 11/12/2021 | 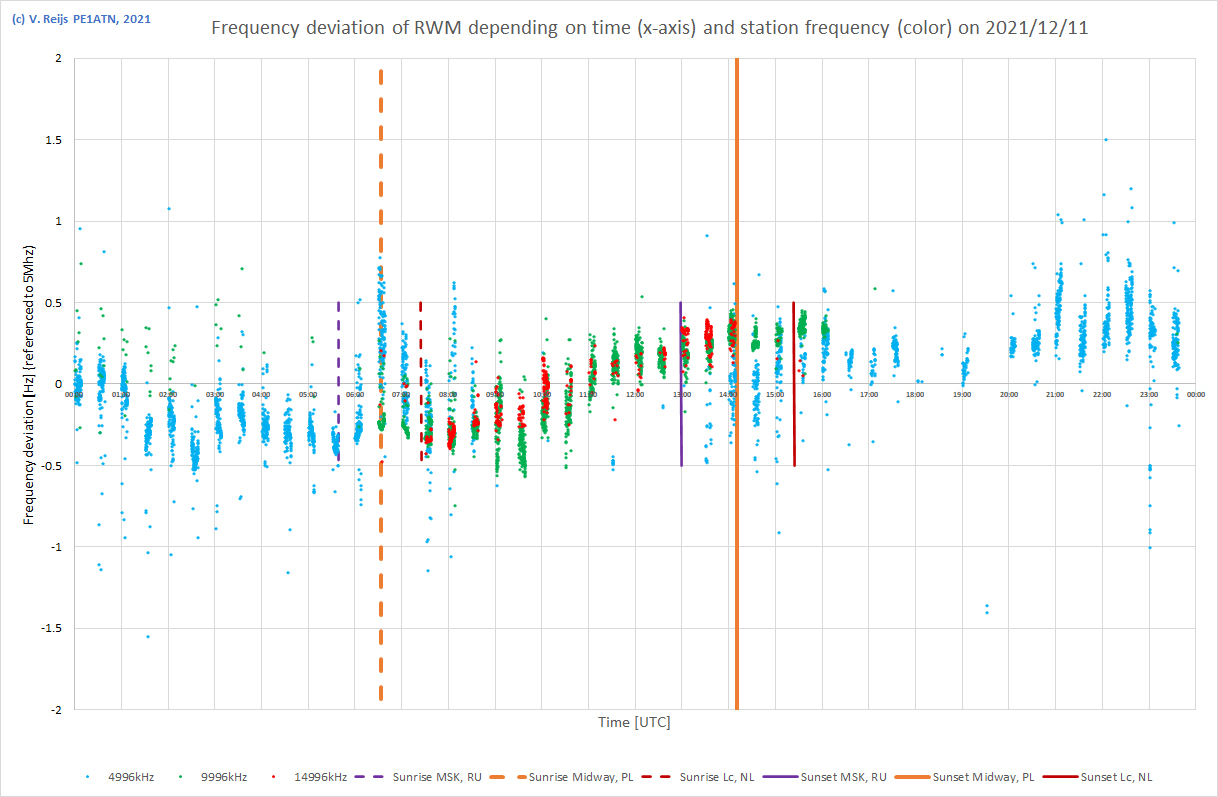 From 19:30UTC 4m height indoors. |
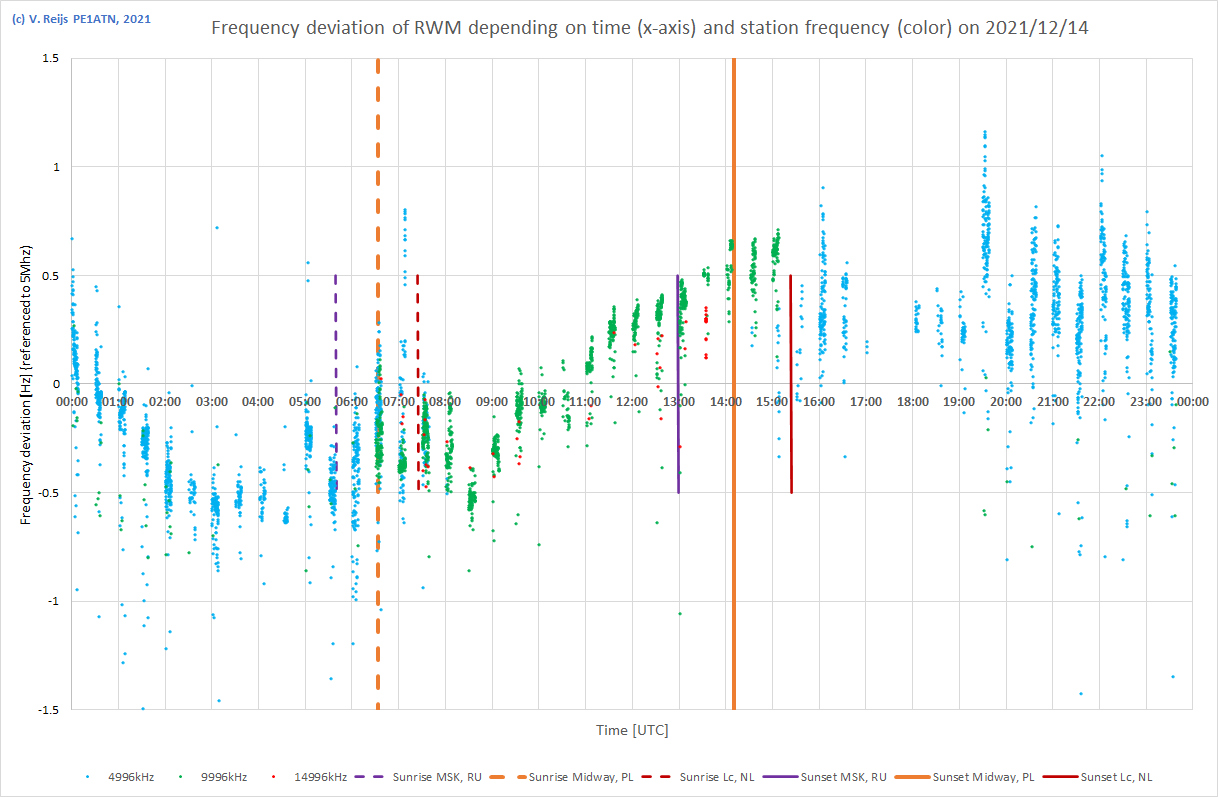
| miniwhip-pro active antenna @
4m height indoors, 2nd stable setup <deviation between -1.5 and 1.5Hz> |
|
| 14/12/2021 |
 |
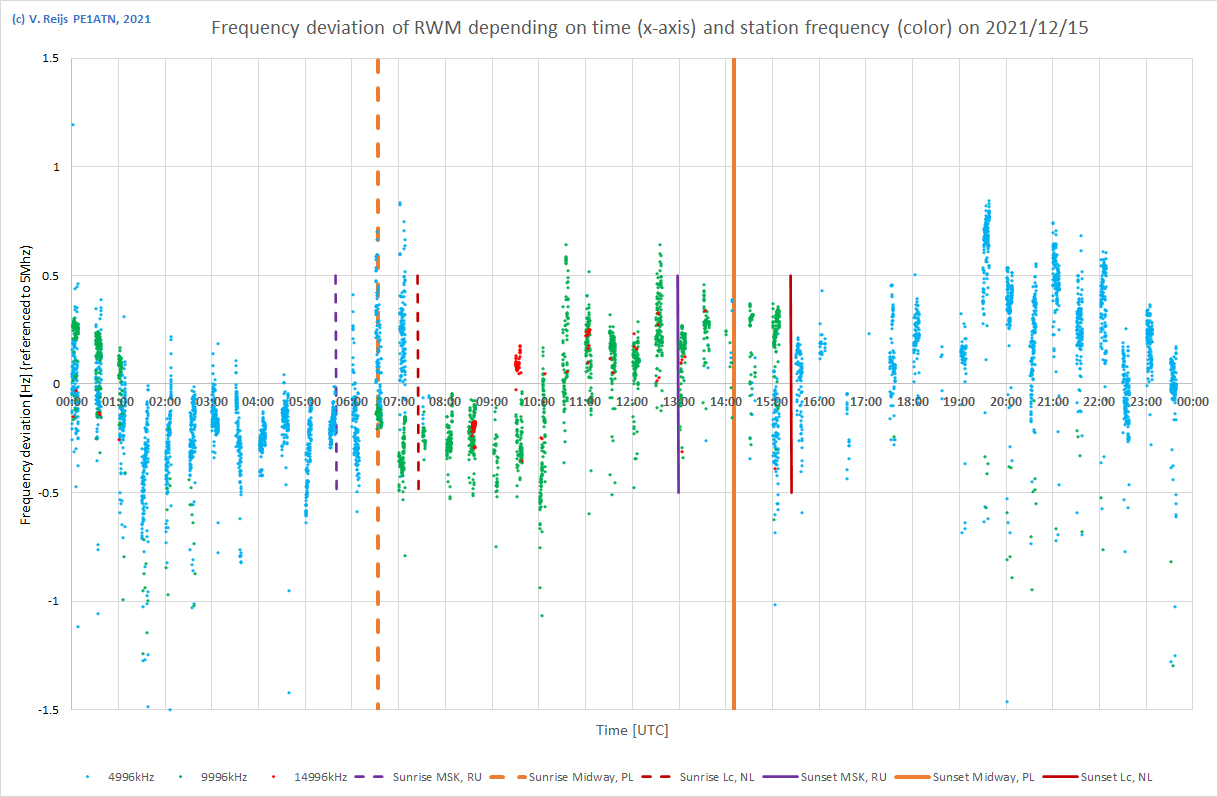
| 15/12/2021a |
 |
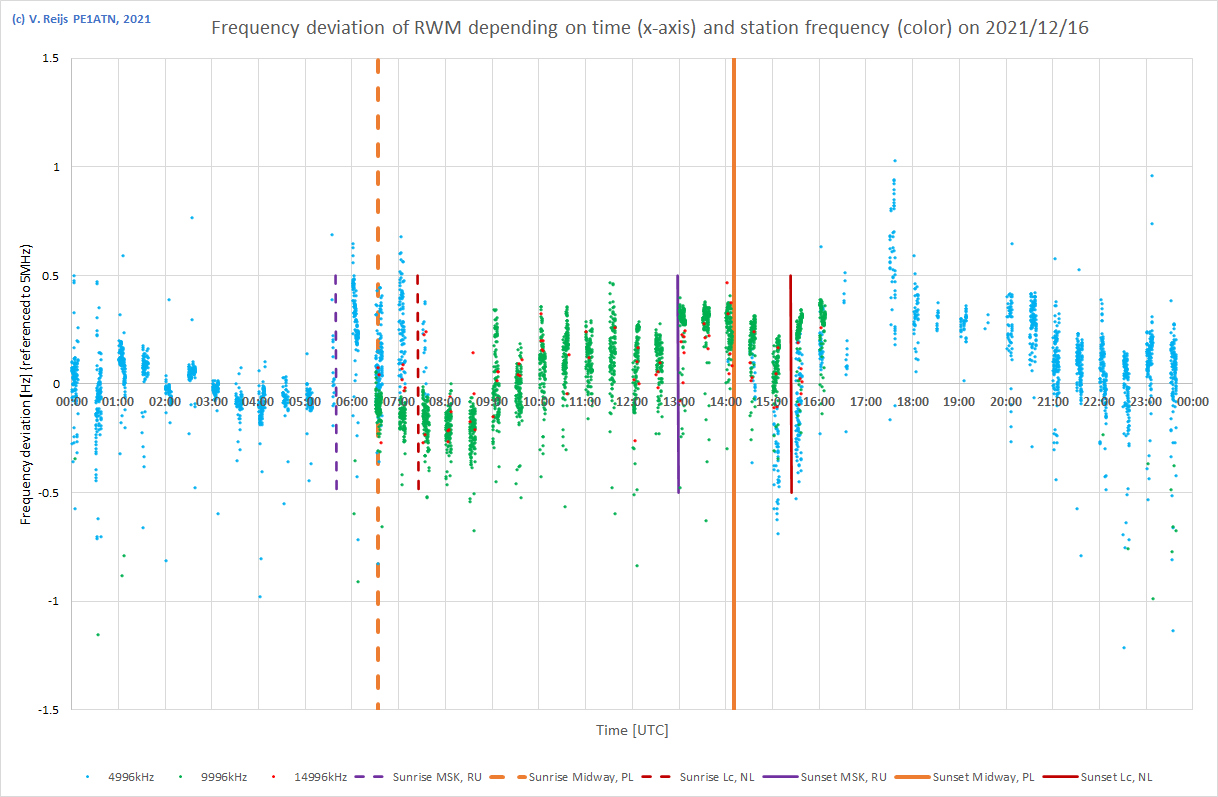
| 16/12/2021 |
 |
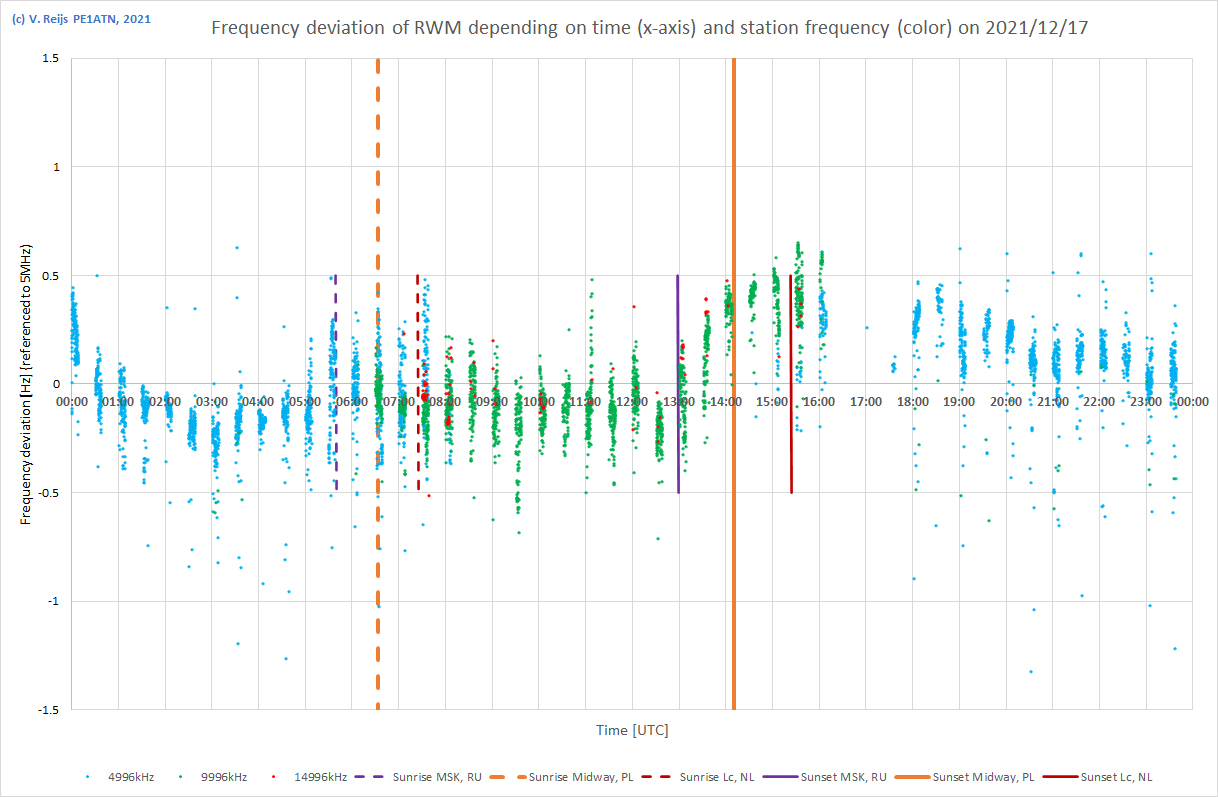
| 17/12/2021 |
 |
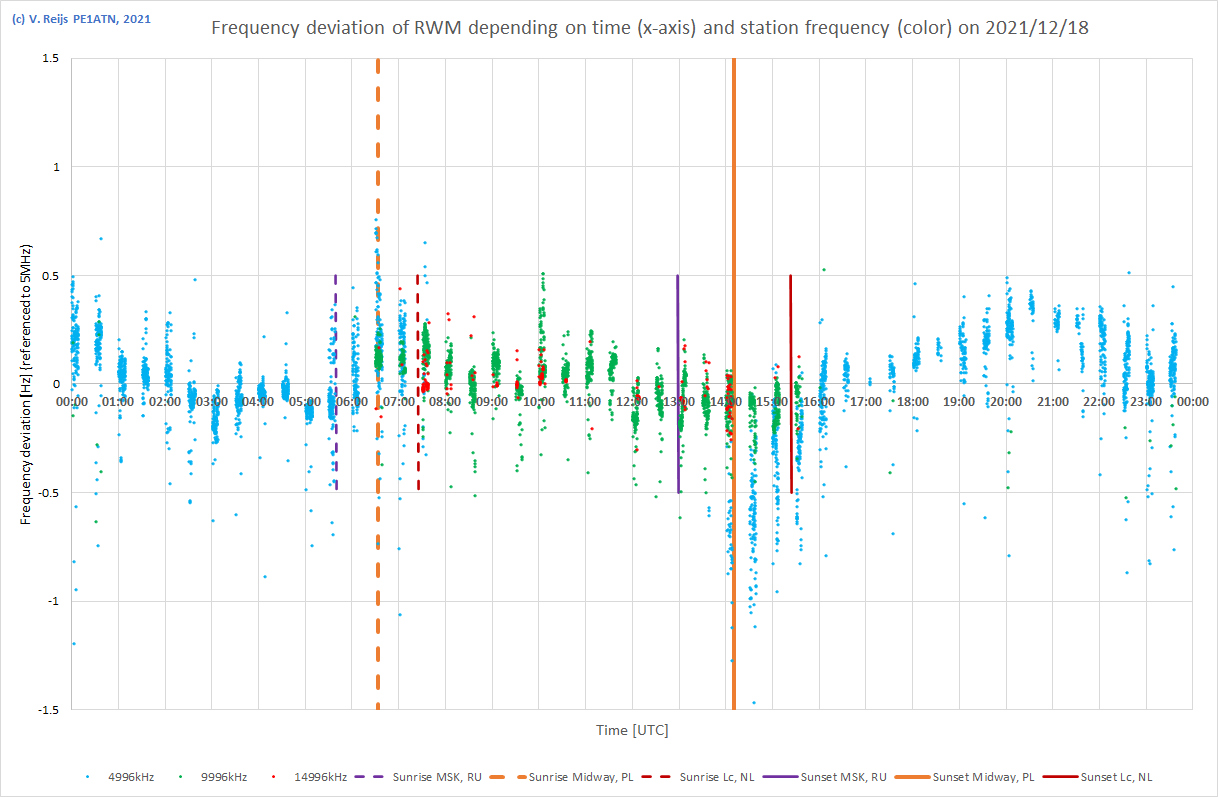
| 18/12/2021 |
 |
| 19/12/2021 |
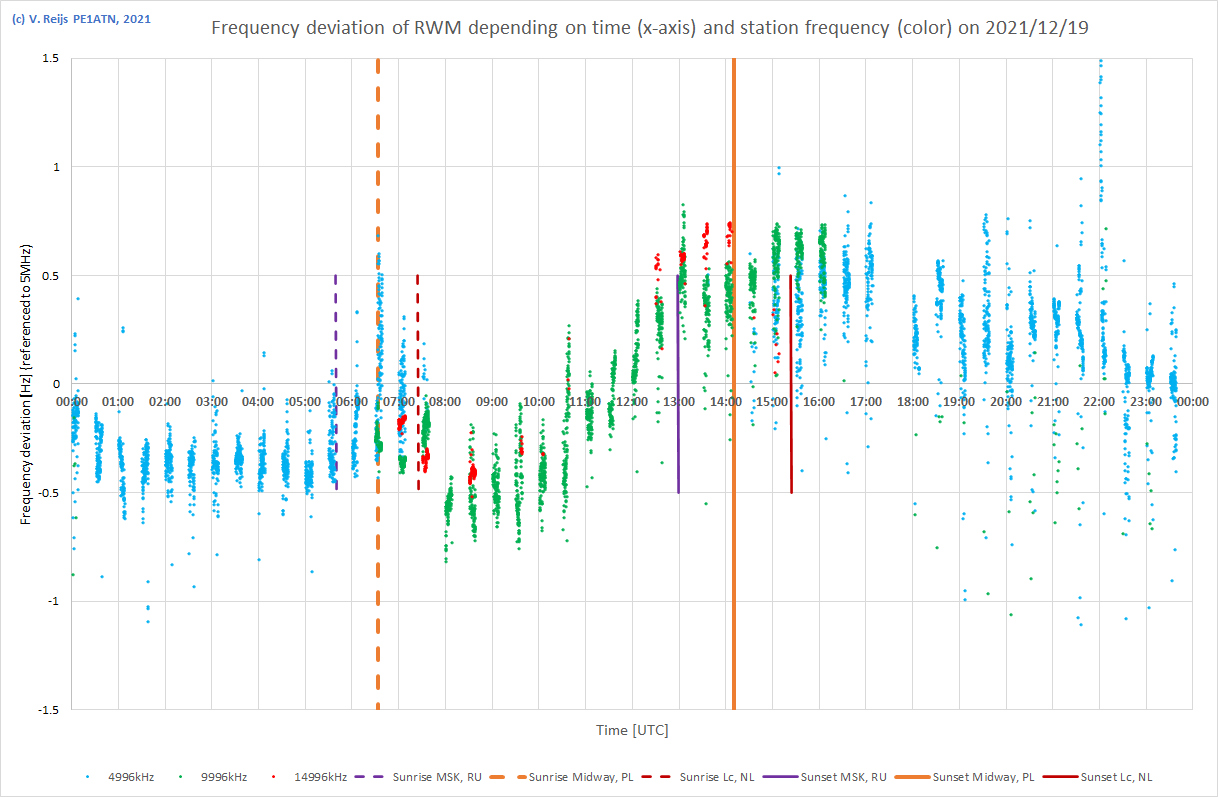 |
| 20/12/2021 |
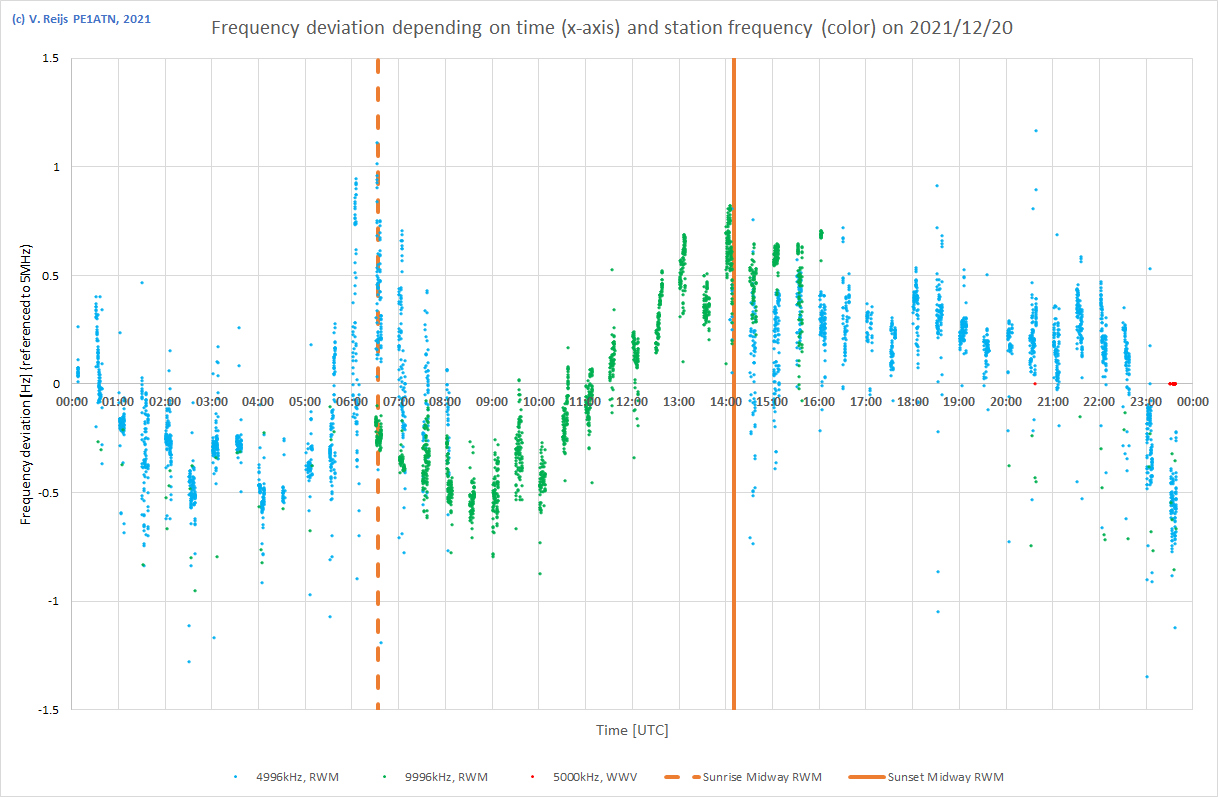 |
| Remarks |
|
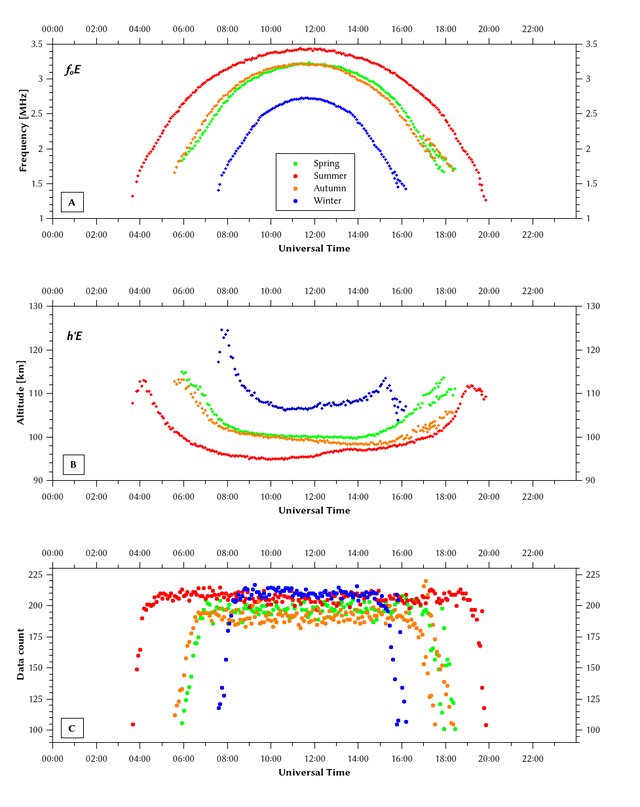
The critical frequency (fo) and height of the layers
during the day can be seen in below illustrative pictures
(so not necessarily correct for the location in this eclipse
research, but the form/behavior is similar).
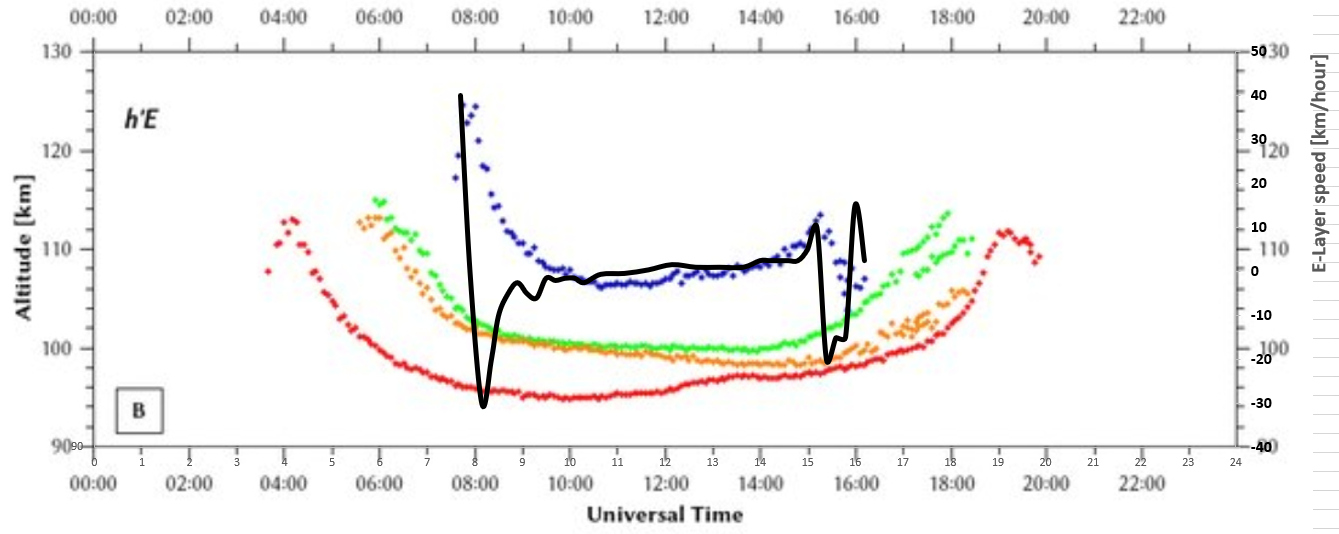
An height and foE
plot for the E-layer is below (Verhulst&Stankov, 2017,
Fig. 4B):
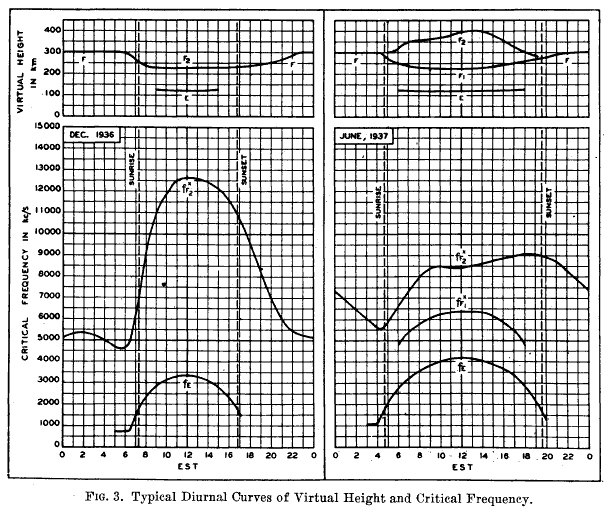
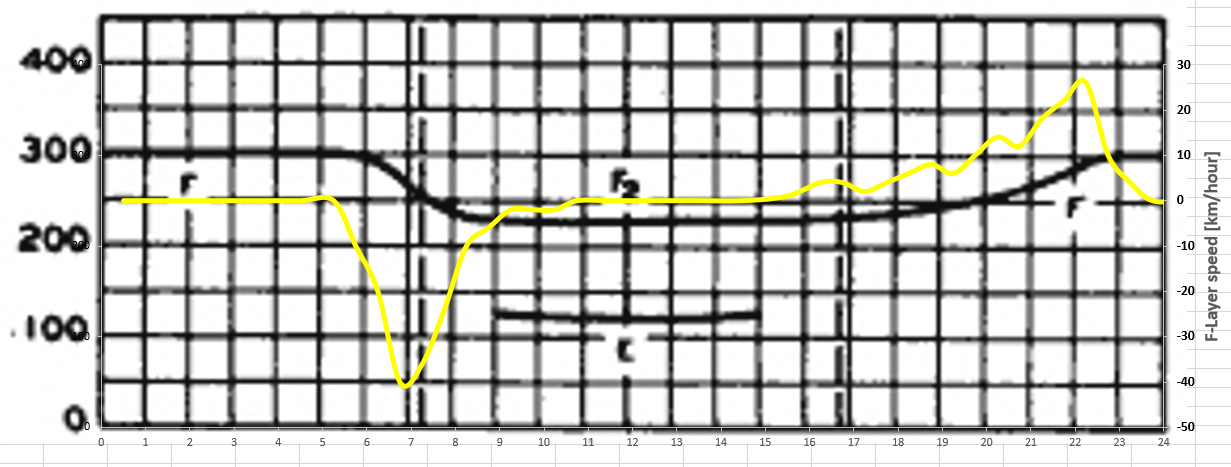
A height and foF2 plot for the
F-layer is here (Smith, 1951, page
257):
Here is an almost real time view of the fo and height
of the F2-Layer: IRTAM and GAMBIT
D-layer's absorption has similar (symmetrical) diurnal behavior as
the E-layer (Smith, 1951, page 260), but it is of course about
absorption (instead of reflection).
A vertical beam with critical frequency (fo) will just
be reflected at the mentioned layer (beams of higher frequency
will pass through).
In case the beam is not vertical a higher reflective higher
frequency (MUF: Maximum Usable Frequency) can be reached. This is
related to the MUF-factor.
MUF = fo * MUF-factor
<Poole (2004, page 44) looks to have a
typo: instead of the '*' it has wrongly a '/'>
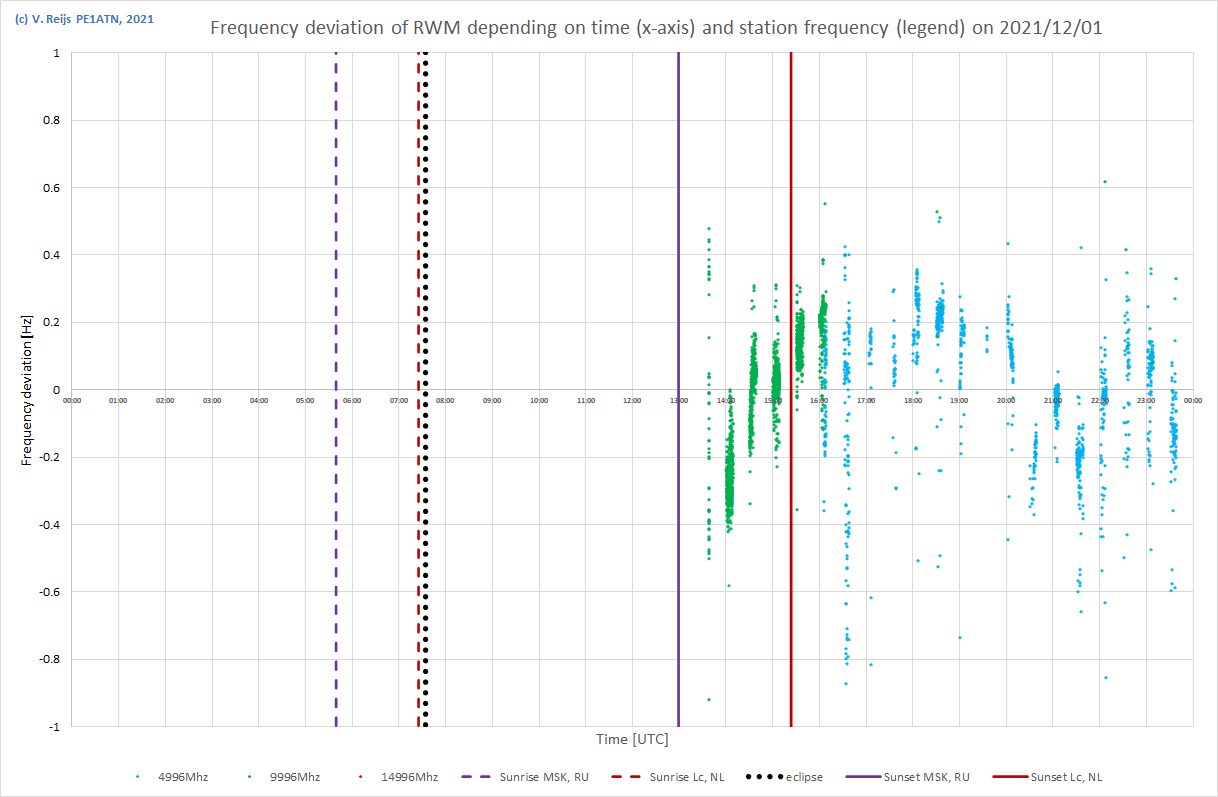
For a path of some 2250km (which is the when looking at RWM and
Lc); the E-layer has a MUF-factor of
4.8 and the F-layer a MUF-factor of 3.2 (Poole, 2004, page 44).
So 4,996kHz might just use the E- and F2-layer behavior and the
9,996kHz and 14,996kHz will most likely only use the F-layer
behavior (for our case: DEC. 1936/left plot in above picture).
A height plot over the day for the E-layer and F2-layer can be seen above. Winter time
curves are important for this particular eclipse research.
The frequency deviation (doppler effect) will depend on the height
change. So one needs to differentiate these plots.
The speed (black line) of the E-layer after differentiating is (Sun rise @ 07:40 and Sun set @ 15:40):
The speed (yellow line) of the F2-layer after differentiating is (Sun rise @ 07:15 and Sun set @ 16:45):
We need to combine, the time of day, the speed of the E- or
F-layer, MUF of E- of F-layer, the Sun's dip angle and the
absorption of D-layer, to provide a theoretical frequency
deviation over the day. The below is all about the qualative
behavoir.
An attempt has been made to simulate the behavior at the three
frequencies:
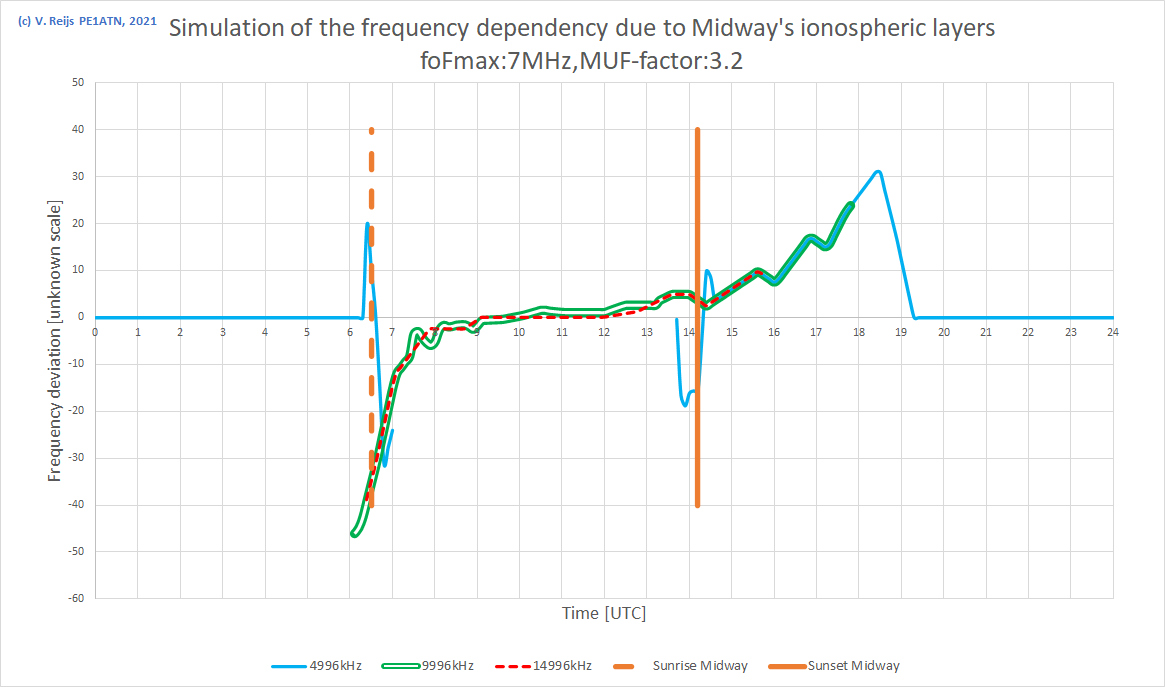
This has been derived from the above Layer-Heights, Layer-fo,
dHeight/dTime, D-layer absorption, dip angle and
adjusting for the Sun's position @ Midway. The deducted MUF-factors
are around the expected 3.2 (for F-layer) and 4.8 (for E-layer).
The simulation in general looks to follow the timing of the
measurements more or less. The F2-layer downward's trough just
before Sun rise is not visble in the 4,996kHz curve as that
F2-trough is partly in de 'shadow' of the E-layer (remember the
radio waves are under an angle of some 12°/18° when reaching the E/F-layer).
The F2-layer height (hmF2) has been traced from GAMBIT for 16-12-2021 at Midway RWM (red curve). To get the speed one needs to differentiate the height (purple curve),
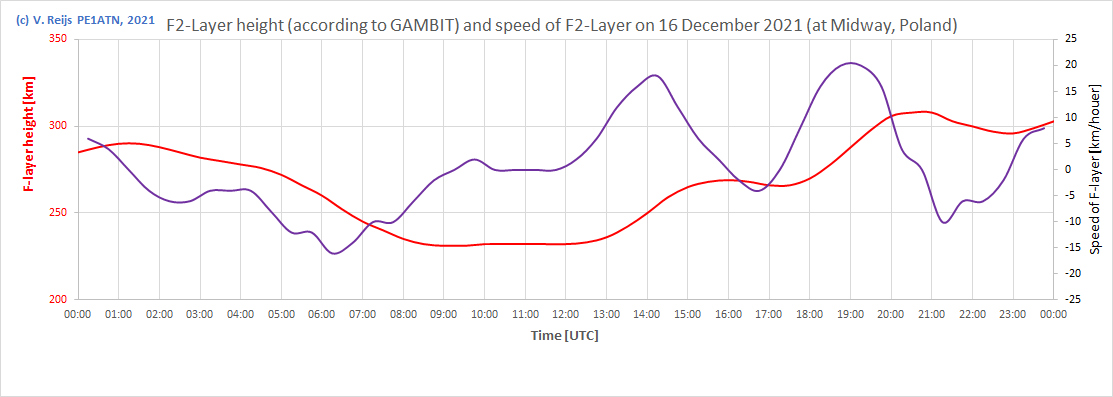
This speed can be transformed into a
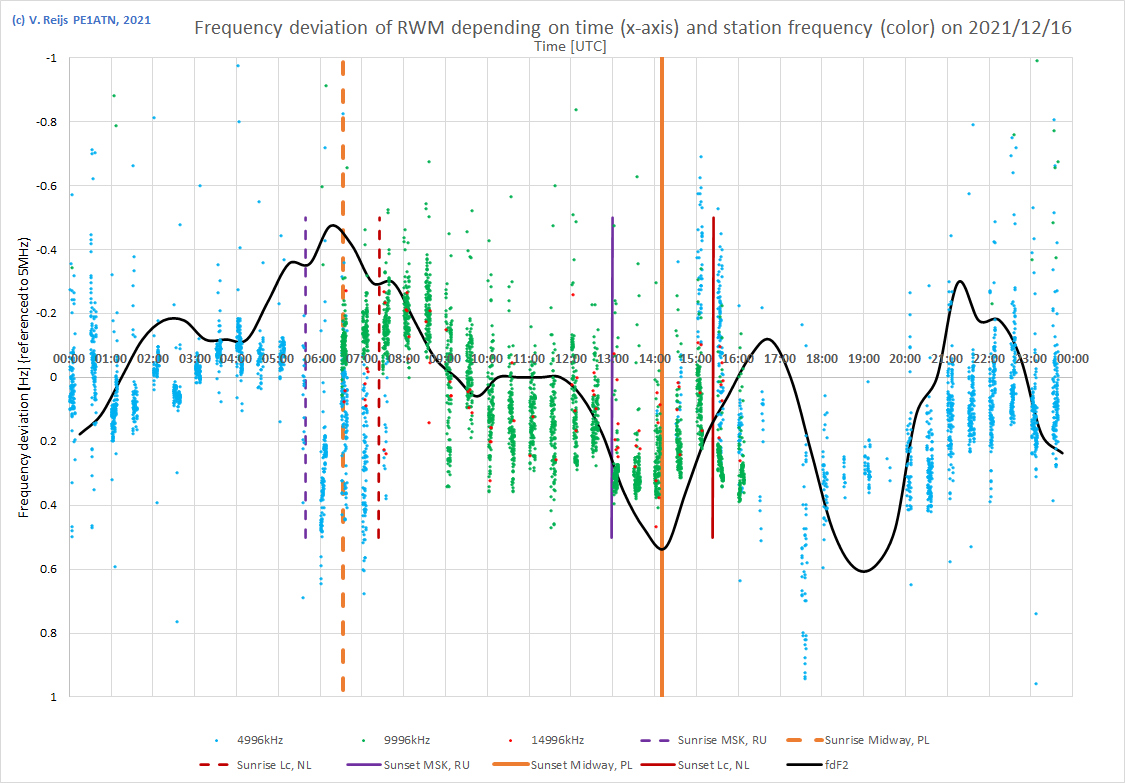
frequency deviation (black curve in below graph) by using:
Frequency deviation [Hz] (doppler effect) = ((<light speed
[km/sec]> + <speed of layer [km/sec]>)/(<light speed
[km/sec]> - <speed of layer [km/sec]>) - 1) * <Station
frequency [Hz]> * MUF-factor
<the MUF-factor [3.2] is included, as the
radio waves do not fall perpendicular on the F-layer>
This gives the following picture:
I think there migth be a different behavior when we swap the
receiver and transmitter locations; as the layers are
'illuminated' differently.
The total eclipse in Antarctic is far away, does this have an influence on the ionosphere around middle Europe?
Perhaps this can be compared with the 21 August 2017 total
eclipse and the related results.
The influence on the ionosphere of a total eclipse looks to be
around 45° (from the centre of the eclipse), as the Dec 2021
eclipse is at around latitude 76° S, its influence might extend to
30° S, so quite far away from Midway RWM (53° N).
From above
measurements, no real effect can be seen in The Netherlands
from the total eclipse. But perhaps statistical analysis (by the Antarctic Eclipse
Festival) could proof differently. The measurements have
been shared with that group and Zenodo.
During two weeks the RWM continous carriers has been measured
using the SDR FLEX-1500. The radio frequency is not 100% the
station frequency. To get to hear the RWM station signals at 1kHz,
we need to put the radio on a slightly different frequency. But
this difference does not seem to change over time, so the
frequency stability of the FLEX-1500 looks to be good. It is
unlikley due to the height of the indoor aerial, but it could
difference in room temperature. Need to investigate further.
The E- and F-layers at the midway location between transmitter
and receiver is determining the effects of these layers.
The E- and F-layer are illuminted by the far/extreme UV rays and
this starts with Sun's dip angle of respectively 4° and 10° (so
not the same Sun dip angle if it were visible rays, which would be
10° and 18°).
At a qualitative level we can simulate the freqeuncy deviation
(due to the doppler effect) of radio ways based on modeled E- and
F-layers (by looking at [change of] fo/MUF, change of
layer-height, absorption in D-layer, time of day and location).
The measured frequency deviation did not really change
significant during the day of the eclipse. This is perhaps also
not expected so far away from the total eclipse location (distance
between Poland and Antarctic).
The Antarctic Eclipse Festival are here available.